HAVE A QUESTION?

Get in touch.

Get in touch - Side Form

Sold simply. With care.

What’s new at HofVan

Blog

HofVan Real Estate Group always puts the information needs of our clients first. Read these blog posts for tips, suggestions and other newsworthy notes to help sellers and buyers in the Lower Mainland real estate market.

RSS

April 2020 Decreases in Sales But Prices Steady

After one full month of BC’s shutdown due to the COVID-19 crisis, the numbers for April 2020 may surprise you.

Lower Number of Sales for April Average

According to the latest stats package from the Real Estate Board of Greater Vancouver, the sales for April 2020 was the lowest the month has been in 10 years for the April sales average. This April was 62.7% below the 10-year April sale average. This is the lowest this month has been since 1982.

The number of sales and listings declined. This was not unexpected due to COVID-19.

“Predictably, the number of home sales and listings declined in April given the physical distancing measures in place,” Colette Gerber, REBGV’s president-elect said.

April 2019 had 586 detached sales recorded. Detached sales for April 2020 totaled 338. A 33.8% decrease compared to the same time last year.

There were a total 503 sales of apartments in April 2020. A 43.2 per cent decrease compared to the 885 sold homes in April 2019.

Attached homes in April 2020 had a total of 218 sold. A 39.1 per cent decrease compared to the 358 sales in April 2019.

Home Prices in April 2020 Remained Balanced

The benchmark price of detached homes was $1,462,100. An increase of 0.8% compared to March 2020.

Apartments had a benchmark price of $685,500. Compared to March 2020 this is a 0.2% decrease.

Attached homes had a benchmark price of $796,800. A 0.6% increase compared to March 2020.

Markets like Burnaby South and East Vancouver actually increased in benchmark pricing.

New Ways to Market your Home

Our goal as REALTORS® is to use the latest technology to market your home safely. Using technology like Matterport allows buyers to virtually walk through the home.

Click to see how we used Matterport to showcase a North Vancouver townhome.

Depending on the home, we also use doll house floor plans to give potential buyers a feel of the house.

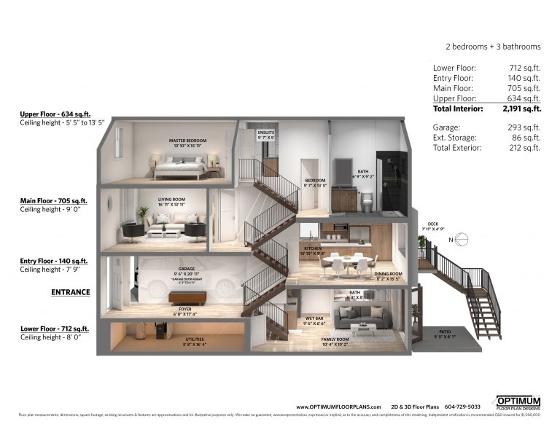
Dollhouse Floor Plan provided by Optimum Floor Plans.

Providing buyers with as much information before a showing can helps buyers make informed decisions.

For the latest stats from the Real Estate Board of Greater Vancouver, click here.

Click here to see what happened last month.

Read

March 2020 Starts Strong but Adjusts to The New World

According to the Real Estate Board of Greater Vancouver (REBGV), March 2020 home sales increased compared to last month’s.

In February, Metro Vancouver saw a total of 1,727 sales. March sales increased by 17.4 percent, jumping to a total of 2,524 sales.

Last year in March, there were only 1,727 sales. Sales have increased by 46.1% when compared to last year.

Multiple offers were more common March 2020

“The first two weeks of the month were the busiest days of the year for our region with heightened demand and multiple offers becoming more common,” said Ashley Smith, REBGV president.

It was not uncommon to see homes sell above list price, giving more purchasing power to sellers.

Condos, single-family homes and attached properties were all in a seller’s market for the month of March.

Compared to March of last year, the detached market increased by 61.1%. Condos in Greater Vancouver increased by 35.1%. March 2020 attached sales increased by 51.7% when compared to last year.

The Effects of COVID-19 towards the end of March 2020

REALTORS® were named an essential service by the Minister of Public Safety and Solicitor General.

During this crisis no open houses are allowed, this is to help with the prevention of the Coronavirus. Although business is still open for agents, this is not business as usual.

Sales saw a decrease for the last few weeks of March 2020

The number of Daily residential sales for the first ten business days of March were 138 on average. In the final ten business days of March 2020, the daily average declined to 93 sales. We’ll have to wait and see the effects of COVID-19.

To see the latest statistics for March 2020 from the Real Estate Board of Greater Vancouver, please click here.

Check out our blog post regarding the Coronavirus (COVID-19).

Special thanks to Tomas Williams for the beautiful photo of Robson.

Read

Coronavirus (COVID-19) and the Effect on Vancouver’s Housing Market

In short, no one has a concrete answer the effects of the Coronavirus (COVID-19). The last few months for Vancouver have seen a huge pick-up in sales but will that continue? There are numerous changes happening in the industry. Only time will tell how the Coronarvirus affects the industry.

What economists are saying about the effects of the Coronavirus?

RBC economics suggest that the hot market from Vancouver may cool down due to the Coronavirus. Despite the Bank of Canada reducing interest rates by 50 basis points.

“The world has changed in March,” Robert Hogue, a senior economist from RBC, writes.

“We are coming to the view now that because of the virus and the meltdown in financial markets… We will mostly likely see a decline in buying activity through at least parts of the spring market, and maybe even going into the summer market.”

Hogue believes that self-isolation and the lack of movement due to the Coronavirus may prevent buyers from the act of shopping for homes. Buyers may be more weary taking on a larger mortgage.

How the Coronavirus creates a new normal

Industries continue to adapt to the changes that the Coronavirus brings.

CIBC will keep it’s locations open but with modified hours. Centers that don’t offer over the counter banking and cash services will be closed until further notice. The bank will also be offering work from home solutions to staff that are not in customer facing roles.

Customers of Central 1 Credit Union are encouraged to use digital platforms. The credit union believes their site will be able to handle the increased traffic.

Canada Guaranty is looking for new solutions for customers that find themselves under financial hardship. The mortgage insurer’s Homeownership Solution Program prior allowed lenders to capitalize up to four monthly mortgage payments but this can be increased to a maximum of six monthly payments, depending on certain conditions.

LTSA

LTSA, Land Title and Survey Authority of British Columbia, will be accepting an Affidavit of Execution sworn under section 49 of the Land Title Act. This is due to social distancing caused by the Coronavirus. Documents can be signed by the transferor on one page and witnessed by an officer on a separate page. This will allow both to remain at a safe distance.

Still, the requirements for the Land Title Act require the transferor to be in the presence of an officer. Videoconferencing is not an acceptable alternative.

Vancouver’s Real Estate as it stands

At the moment, it is not uncommon to see some homes sell above listing price and in a week or less. However the effects of this virus are still very new. With changing mortgage rates we will have to see how this may or may not impact the market.

A time to be sensitive

It is important to be sensitive to other needs. Not all sellers may be comfortable allowing people to enter their homes while COVID-19 is in effect. Sellers may be following instructions from the government if they are self-isolating after travelling.

Seniors selling their home must be careful allowing people to enter their homes.

The Real Estate Board of Greater Vancouver has advised agents to not host open houses. This is to prevent the spreading of the virus.

Earlier this week, REBGV also removed the rule requiring that properties listed on MLS® be made available for showings.

If you are curious about seeing what areas are selling above or below the listing price check out our Real Estate Tools and Maps. By logging in you will have access to our insights. You will be able to see which areas are hot to buy and sell.

 
Read

July 2019 Greater Vancouver Real Estate Market Update

Summer sales are happening in Vancouver!

Demand for greater Vancouver homes increased since last month and despite July being a usual quieter month in Vancouver, July 2019 has been the second highest selling month for the year. The Real Estate Board of Greater Vancouver (REBGV) reports that there were 2,557 residential home sales in Greater Vancouver and sales for July 2019 have increased by 23.1% since last month.

Did you miss the stats for last month? Check them out here.

July 2019 sales increase compared to July of last year.

Residential home sales increased by 23.5% compared to the 2,070 sales recorded for July 2018.

Inventory of homes decrease.

A total of 4,613 detached, attached and apartment properties were newly listed for the month of July. This is a 3.3% decrease compared to the 4,770 homes listed July 2018. As well as a 4.9% decrease compared to June 2019’s 4,751 properties listed.

The total number of homes currently listed according to REBGV is 14,240. This is a decrease compared to June 2019 which at the time had 14,968 properties listed.

The benchmark price of homes in Vancouver decreases a bit.

The MLS® Home Price Index composite benchmark price for residential properties in Metro Vancouver is currently $995,200. This is a 9.4 per cent decrease over July 2018 and a 0.3 per cent decrease compared to June 2019.

Detached, attached and condo sales for June 2019.

Sales of detached homes in July 2019 reached 841, a 32 per cent increase from the 637 detached sales recorded in July 2018. The benchmark price for detached properties is $1,417,000. This represents a 10.5 per cent decrease from July 2018, and a 0.5 per cent decrease compared to June 2019.

Attached home sales in July 2019 totaled 473, a 33.6 per cent increase compared to the 354 sales in July 2018. The benchmark price of an attached unit is $770,000. This represents a nine per cent decrease from July 2018, and a 0.6 per cent decrease compared to June 2019.

Sales of apartment homes reached 1,243 in July 2019, a 15.2 per cent increase compared to the 1,079 sales in July 2018. The benchmark price of an apartment property is $653,200. This represents an 8.8 per cent decrease from July 2018, and a 0.2 per cent decrease compared to June 2019.

How many homes sold in Vancouver for July 2019?

All together Vancouver saw the sale of 763 homes sold for the month of July 2019. In July, Vancouver East had a total of 274 homes sold, while Vancouver West saw the sale of 489 homes.

Vancouver’s single family detached homes.

In July, Vancouver West sold 79 detached homes. The benchmark price for the month of $2,895,400 having a 0.6% decrease from June 2019. The median price for the month is $3,025,000.

There were a total of 104 sales for detached homes in Vancouver East.
$1,352,800 is the benchmark price for the month of July. This was 0.2% increase from the previous month. The median price for Vancouver East for the month is $1,355,000.

Vancouver’s condo market.

Vancouver West had a total of 352 sales for condo properties. The July 2019 benchmark price for Vancouver West’s apartments is $752,300, a 1.1% increase from June 2019. The median price for the month is $750,000.

In Vancouver East there are a total of 128 apartment properties sold for the month of July. $550,600 is the benchmark price for June 2019 which decreased by 0.6% compared to last month. $564,850 is the median price for the month.

The attached market for Vancouver

In Vancouver West there were 58 sales for attached properties. July’s benchmark price for townhomes for July 2019 is $1,114,700. This decreased by 1.0% since June 2019.

Vancouver East had a total of 42 sales for the month. The benchmark price for Vancouver East’s townhouse market is $847,400, which is a decrease by 1.6% compared to last month.

How many homes sold in Burnaby for July 2019?

Burnaby had a total of 298 homes sold for the month.

Burnaby’s single family detached homes.

Burnaby’s detached market saw 77 detached homes sell for the month of July. The median price being $1,475,000.

The benchmark price for Burnaby North single family homes is $1,373,400, this is a decrease of 1.9% compared to the previous month. Burnaby South also decreased by 1.3% to a benchmark price of $1,477,300. Burnaby East’s benchmark price was $1,181,900, an increase of 0.1%.

Burnaby’s condo market.

July’s market sold 164 apartment homes in Burnaby. With $569,000 being the median price for the month.

North Burnaby’s benchmark price for condos $609,500 and increased by 0.3% compared to last month. Burnaby South had a benchmark price $653,500 and decreased by 1.9%. East Burnaby’s benchmark price for July is $721,200 and decreased by 2.0% since June.

Burnaby’s attached market.

In July a total of 57 attached homes sold in Burnaby for the month. The median price being $720,000.

Townhouses in Burnaby North had a benchmark price of $723,100 and is a decrease of 0.3% compared to the previous month. Burnaby South’s townhomes benchmark price for July 2019 is $653,500 and is a decrease of 0.3% compares the June 2019. East Burnaby townhomes increased by 0.6% in July to a benchmark price of $648,400.

Read

June 2019 Vancouver Real Estate Market Update

See July 2019’s update here.

How is the June 2019 real estate market in Vancouver? With homebuyer demands below long-term historical averages in June, the supply of homes for sale continues to build up in Metro Vancouver.

Did you miss last month’s update? See last month’s update here.

The Latest Report from REBGV

In the latest market report from the Real Estate Board of Greater Vancouver (REBGV), residential home sales in the region totalled 2,077 in June 2019, that is a 14.4 per cent decrease from the 2,425 sales that were recorded in June 2018 and a 21.3 per cent decrease from the 2,638 homes sold in May 2019.

Last month’s sales were 34.7 per cent below the 10-year June sales average. This is the lowest total for the month since 2000.

Vancouver’s Increasing Supply

There were 4,751 detached, attached and condo properties newly listed for sale on the Multiple Listing Service® (MLS®) in Metro Vancouver for June 2019. This represents a 10 per cent decrease compared to the 5,279 homes listed in June 2018 and an 18.9 per cent decrease compared to May 2019 when 5,861 homes were listed.

The total number of homes currently listed for sale on the MLS® system in Metro Vancouver is 14,968, a 25.3 per cent increase compared to June 2018 (11,947) and a 1.9 per cent increase compared to May 2019 (14,685).

“We’re continuing to see an expectation gap between home buyers and sellers in Metro Vancouver,” said Ashley Smith, REBGV president. “Sellers are often trying to get yesterday’s values for their homes while buyers are taking a cautious, wait-and-see approach.”

“Home buyers haven’t had this much selection to choose from in five years,” Smith said. “For sellers to be successful in today’s market, it’s important to work with your local REALTOR® to make sure you’re pricing your home for these conditions.”

June 2019 Sales-to-active listings ratio

In June 2019, the sales-to-active listings ratio for all property types is 13.9 per cent. By property type, the ratio is 11.4 per cent for detached homes, 15.8 per cent for townhomes, and 15.7 per cent for condos.

Generally, analysts say that downward pressure on home prices occurs when the ratio dips below 12 per cent for a sustained period, while home prices often experience upward pressure when it surpasses 20 per cent over several months.

The Benchmark Price of Greater Vancouver Homes

The MLS® Home Price Index composite benchmark price for all residential properties in Metro Vancouver is currently $998,700. This represents a 9.6 per cent decrease over June 2018 and a 0.8 per cent decrease compared to May 2019.

This is the first time the composite benchmark has been below $1 million since May 2017.

Detached Home Sales

Sales of detached homes in June 2019 reached 746, a 2.6 per cent decrease from the 766 detached sales recorded in June 2018. The benchmark price for detached properties is $1,423,500. This represents a 10.9 per cent decrease from June 2018 and a 0.1 per cent increase compared to May 2019.

Vancouver’s Detached Market

There were a total of 85 sales of detached homes in Vancouver East, while Vancouver West had 60. This is a decrease in sales from last month. In May Vancouver East had 124 sales and Vancouver West had 86.

In Vancouver West, the benchmark price for detached homes in June was $2,912,000. This is a 0.5% decrease compared to May.

Vancouver East detached homes had a benchmark price of $1,350,100. A 0.2% increase from the previous month.

Burnaby’s Detached Market

Across Burnaby, there were a total of 60 sales of detached homes. This decreased compared to last month’s 67 detached homes sold.

Burnaby North benchmark price of $1,399,800 and Burnaby South benchmark price of $1,496,100 for detached homes saw a decrease of 0.6% and 0.8% respectively. The benchmark price of Burnaby East increased by 1.5% to $1,180,600.

Apartment Sales

Sales of condos reached 941 in June 2019, a 24.1% decrease compared to the 1,240 sales in June 2018. The benchmark price of an apartment is $654,700. This represents an 8.9% decrease from June 2018 and a 1.4% decrease compared to May 2019.

Vancouver’s Condo Market

Vancouver East and Vancouver West condo markets for June 2019 both saw a decrease in benchmark prices by 2.7% and 1.9%. The benchmark prices for Vancouver East is $554,100 and Vancouver West is $744,300.

The number of sales in Vancouver East was 87 while Vancouver West had a total of 254 sales. Last month Vancouver East sold 142 condos while Vancouver West sold 319.

Burnaby’s Condo Market

The condo market in Burnaby saw a total of 128 sales in June. A decrease from May’s 154 sales.

Burnaby East condos benchmark price for June is $736,100. This is a 1.6% decrease since last month. The benchmark price for North Burnaby in June is $607,800, a 1.2% decrease since May. Burnaby South benchmark price decreased since last month by 1.5% for a June benchmark price of $666,200.

Attached Home Sales

Attached home sales in June 2019 totalled 390, a 6.9% decrease compared to the 419 sales in June 2018. The benchmark price of an attached unit is $774,700. This represents an 8.6% decrease from June 2018 and a 0.6% decrease compared to May 2019.

Vancouver’s Attached Market

Vancouver East had a total of 43 sales in the attached market, a decrease from last month’s 60 sales. Vancouver West market had 41 attached homes sold in June. This is a decrease from May’s 55 sales.

The benchmark price in June for Vancouver East townhomes is $861,500. This is a 1.4% decrease since last month. Vancouver West benchmark price increased in June by 0.9% at $1,125,800.

Burnaby’s Attached Market

In June, Burnaby had a total of 52 sales for attached homes. A small decrease from May’s 58 sales.

Burnaby North, South and East townhomes benchmark price saw decreases of 0.7%, 2.4% and 1.9%.

The benchmark price for Burnaby East townhouses in June is $644,300. Burnaby North townhomes benchmark price is $725,500. While Burnaby South’s benchmark price for townhouses is $762,600.

Source:

http://members.rebgv.org/news/REBGV-Stats-Pkg-June-2019.pdf

Read

Real Estate Board of Greater Vancouver’s May 2019 Statistics

May sees an increase in home sales while housing supply reaches a five-year high

The latest stats from The Real Estate Board of Greater Vancouver (REBGV) for the sales of May 2019 were released today June 4, 2019. See highlights below.

The Real Estate Board of Greater Vancouver (REBGV) reported that residential home sales in the region totalled 2,638 in May 2019, a 6.9 per cent decrease from the 2,833 sales recorded in May 2018, and a 44.2 per cent increase from the 1,829 homes sold in April 2019.

Last month’s sales were 22.9 per cent below the 10-year May sales average and were the lowest total for the month since 2000.

The growing inventory of Homes in the Lower Mainland

There were 5,861 detached, attached and apartment properties newly listed for sale on the Multiple Listing Service® (MLS®) in Metro Vancouver last month. This represents an 8.1 per cent decrease compared to the 6,375 homes listed in May 2018 and a 2.1 per cent increase compared to April 2019 when 5,742 homes were listed.

The total number of homes currently listed for sale on the MLS® system in Metro Vancouver is 14,685, a 30 per cent increase compared to May 2018 (11,292) and a 2.3 per cent increase compared to April 2019 (14,357). This is the highest number of homes listed for sale since September 2014 (14,832).

For all property types, the sales-to-active-listings ratio for May 2019 is 18 per cent. By property type, the ratio is 14.2 per cent for detached homes, 20 per cent for townhomes, and 21.2 per cent for apartments. Generally, analysts say downward pressure on home prices occurs when the ratio dips below 12 per cent for a sustained period, while home prices often experience upward pressure when it surpasses 20 per cent over several months.

Vancouver’s real estate market for May 2019

Vancouver East

Vancouver East had 227 detached, 103 attached, and 275 condo listings for the month of May. This was a 6.1% increase, 13.2% increase and 2.5% decrease since April 2019 respectively.

The number of sales in Vancouver East increased for all the residential markets since the previous month. Detached increased by 87.9%, attached increased by 76.5% and apartments increased by 23.5%.

According to REBGV, the benchmark price for residential homes for the month of May is $1,053,900. This is a 0.9% decrease from the previous month.

Vancouver West

Vancouver West had 220 detached, 144 attached and 689 apartment listings during the month of May. This was a 2.7% decrease, 12.2% decrease and a 10.4% decrease since April.

Vancouver West sales increased but not as much as East Vancouver. The detached market increased by 36.5%, the attached market increased by 22.2% and the apartment market increased by 36.9%.

REBGV’s residential homes benchmark price is $1,232,900. A decrease of 0.6% from the previous month.

Burnaby’s real estate market for May 2019

For the month of May, Burnaby had a total of 200 detached listings, 127 attached listings and 317 apartment listings.

Burnaby’s total listings for the detached market saw an increase of 12.4% since last month. The attached market increased by 9.5% while apartments decreased by 1.9%.

Sales increased substantially in Burnaby since April 2019. The sales of detached, attached and apartment markets increased by 26.4%, 65.7% and 49.5% respectively.

Burnaby North

Burnaby North’s benchmark price for residential May 2019 according to REBGV is $879,900. This is a 0.9% increase from last month but a 7% decrease from last year.

Burnaby South

REBGV’s South Burnaby’s residential benchmark price for residential is $971,800. This is a decrease since April by 0.9% and a 7.9% decrease since last year.

Burnaby East

Burnaby East’s residential benchmark price, according to REBGV, is $939,900. This is a decrease of 1.1% since April.

What is impacting the Greater Vancouver real estate market?

“High home prices and mortgage qualification issues caused by the federal government’s B20 stress test remain significant factors behind the reduced demand that the market is experiencing today,” Ashley Smith, REBGV president said.

“Whether you’re a buyer looking to make an offer or a seller looking to list your home, getting your pricing right is the key in today’s market,” Smith said. “To be competitive, it’s important to work with your local REALTOR® to assess and understand the latest trends in your neighbourhood and property type of choice.”

Where to find up-to-date market information?

Did you know you can easily setup your own searches on this website? Just click here to access our free real estate tools. By creating an account you get access to sold data, personalized search tools as well as our insights. With our insights, you can see which areas have the highest sales volume. As well which areas are selling below or above the asking prices. Check it out!

Sources:

http://members.rebgv.org/news/REBGV-Stats-Pkg-May-2019.pdf

Read

What is the First-Time Home Buyer Incentive?

The 2019 Canadian Federal Pre-Budget was released Tuesday, March 19th and plans to introduce a new program called the “First-Time Home Buyer Incentive”. This new funding hopes to alleviate some of the stress on first time home buyer’s when it comes to housing affordability. According to the budget, the government predicts that approximately 100,000 first-time home buyers would benefit from the incentive over the next three years. If the government were to implement the plan, here is what it may look like.

How could the “First-Time Home Buyer Incentive” help in Vancouver?

One part of the incentive would allow first-time home buyers that have a minimum down payment for an insured mortgage to make an application to finance a portion of their purchase through a shared equity mortgage with the Canada Mortgage and Housing Corporation (CMHC). According to The Vancouver Sun, eligible buyers could be offered a ten percent shared equity mortgage for a new home or a five percent for an existing home. The Canadian government will be able to recoup its cost when a home is sold. This proposed incentive will be available to households with incomes under $120,000 and on mortgages that are no more than four times the household’s total income. As the Globe and Mail points out, this restriction limits the purchase price to be just below $480,000. Click here to view the proposed First-Time Home Buyer Incentive here.

Every month the Real Estate Board of Greater Vancouver releases sales stats for Metro Vancouver. Now looking at the latest statistics provided for March 2019 in Metro Vancouver the benchmark sale price (benchmark representing a typical property within each market) for the overall residential properties is $1,011,200. The only cities for apartments with a benchmark price below $500,000 would be Ladner, Maple Ridge, Pitt Meadows, Port Coquitlam, Squamish and Tsawwassen. That’s not to say there aren’t homes below $500,000 in cities such as Vancouver, Burnaby or Coquitlam, they just aren’t as abundant as the aforementioned cities.

Looking at the Benchmark Prices (BP) in Metro Vancouver, the First-Time Home Buyer Incentive would only help in the current market for apartments in certain areas and not for majority of single family detached properties or townhomes. Burnaby North, Burnaby East and Vancouver East’s apartment BP increased by 0.5% from February to March. These areas are already past the benchmark price of $480,000. If the increase remains the same, the difference between the benchmark price and the limit of the First-Time Home Buyer Incentive would continue to grow further apart. Even in areas where the apartment benchmark prices decreased, such as Burnaby South, Vancouver West and Richmond, their prices are still well above the $480,000 and would need to drop significantly to qualify for the proposed incentive.

If we were to look at the apartments with a sales median price below $480,000, the cities are Port Coquitlam, Maple Ridge, Whistler and Pemberton. Looking at the previous month the median price of Burnaby jumped from $557,500 to $574,250. In Coquitlam the median price of apartments went from $478,000 to $527,000. Whereas if you looked at Vancouver East’s median price, the selling price went from $576,000 to $558,350. As the Home Buyer’s Incentive has not been approved yet, prices may change by the time it would come into effect.

Immediate Increased Withdrawals from your RRSP

The second part of the “First-Time Home Buyer Incentive” allows higher maximum tax-free withdrawals from the Registered Retirement Savings Plan (RRSP). This would increase the amount from $25,000 to $35,000 which, according to the Globe and Mail, is effective immediately.

Chances are that since the majority of homes in most areas do not fit below the $480,000 benchmark price average, this proposed First-Time Home Buyer Incentive will most likely not be available for a majority of properties in Vancouver and Burnaby. If anything the incentive would only be applicable to some apartments and not a majority of townhomes or detached properties. However the higher tax-free withdrawals from RRSPs will give a slight edge to a buyer’s purchasing power. But is that withdrawal enough, well that might be a different story.

To get deeper insight in the Greater Vancouver Real Estate Market, please check out our search tool. If you haven’t already, register here for even deeper insights.

Sources:

https://www.budget.gc.ca/2019/docs/plan/chap-01-en.html#Introducing-the-First-Time-Home-Buyer-Incentive

https://www.theglobeandmail.com/investing/personal-finance/article-federal-budget-2019-eight-ways-the-budget-will-affect-your-personal/

https://budget.gc.ca/2019/docs/themes/housing-logement-en.html

https://vancouversun.com/news/local-news/first-time-home-buyers-big-winners-in-budget-but-will-incentives-work-in-b-c

http://members.rebgv.org/news/REBGV-Stats-Pkg-March-2019.pdf

Read

Short-Term Rentals Come With Responsibilities.

Short-term rentals can seem like a great way to utilize the extra space in a home and have an additional income, but it comes with a lot of legal responsibilities.

When travelling to other countries and cities, it can be easy to find an Airbnb. It may sound like a great business idea to make a property you own in Vancouver a short-term rental. However, it’s not as simple as posting an ad on Airbnb.ca.

Please enjoy this article and keep in mind that we are not licensed property managers nor do we run any short-term rentals ourselves. People who are seriously considering running an Airbnb or short-term rental should think of this article as a starting point to their research. Before pursuing short-term rentals, it’s important to seek legal advice and contact the local municipality.

According to Vancouver.ca a short term rental is an entire home or a room within that home, that is being rented for a period that is less than thirty days.

Anyone renting out their home as a short-term rental should operate from their principal residence, which is the address where he/she lives as an owner or tenant, and uses for bills, insurance, ID or taxes. Short-term rentals are only permitted in secondary homes or basement suites if an operator lives there full-time. Tenants wishing to rent out their homes need to get written permission from their landlords. Also, if an operator is living in a strata property, he/she must make sure that the strata bylaws allow for short-term rentals. A person renting out a property that is stratified would need written permission from both the landlord and the strata corporation. Short-term rentals are not allowed in homes that pay the Empty Homes Tax.

If an operator can accommodate short-term rentals in their principal residence, they should first get a short-term rental business license. Before applying for one, it’s essential to ensure that the property meets the licensing requirements. Some requirements include having a carbon monoxide detector on every floor there is a gas appliance, having interconnected smoke alarms on every floor and in every bedroom, posting a fire escape plan at every entrance and exit. These are just a few of the requirements. Please check Vancouver.ca’s short-term rental business requirements for a thorough list.

As of January 22, 2019 application fees for new business licenses are $58. To see up-to-date pricing, please visit Vancouver.ca.

An operator running a short-term rental without a business license could be in danger of incurring fines of up to $1,000 per offence, some of which can include but are not limited to operating without a business license, advertising or listing short-term rentals without displaying a valid-business license, operating a short-term commercial rental or operating in an unsafe or nuisance property.  Commercial operators and those with repeat offences may be subject to prosecution and face fines of up to $10,000.

The above article was written specifically for Vancouver’s policies on short-term rentals. For short-term rental policies in other cities, contact the local municipality. To find more information and keep up to date with short-term rental regulations specifically for Vancouver, please visit Vancouver.ca or call 3-1-1 (604-873-7000 if you are outside Vancouver).

Regardless of which city you pick to run a short-term rental, you would have to check with an insurance broker to review the home insurance policies.

Source:  https://vancouver.ca/doing-business/short-term-rentals.aspx

Read

Speculation and Vacancy Tax

The Speculation and Vacancy Tax was created by the Provincial Government and is part of the government’s 30-Point Plan on Housing Affordability to make housing more affordable for the people in BC.

The following are some of the reasons the Speculation and Vacancy Tax was created:

  1. To tackle housing crises in major urban centres in British Columbia.
  2. To ensure that people who earn the majority of their income outside BC contribute their fair share in taxes.
  3. To discourage foreign buyers from using homes in BC as a way to earn a profit.
  4. To encourage owners to rent or sell empty homes so more homes will be available for people who need them.
  5. To provide housing to people who live and work in BC

If you own a property that falls in the taxable region, all owners registered on title will be expected to complete a declaration. Before making a declaration on your own, or on behalf of someone, it is important to seek independent advice outside of this article and/or email (spectaxinfo@gov.bc.ca) or call the BC government’s direct line about the Speculation and Vacancy Tax (Toll Free: +1 (833)-554-2323/Outside North America Office: +1 (604)-660-2421). Their office hours as of the date of this article is seven days a week from 8:00 A.M. to 8:00 P.M. Pacific Standard Time. As well as visit the BC government’s site for up to date information.

What is housing speculation?

Speculation, as defined by Investopedia, is the act of conducting a financial transaction that has substantial risk of losing value, but with the expectation of a significant gain. With speculation, the risk of loss is more than offset by the possibility of a huge gain. The lines between investment and speculation can at times be blurred, but some determining factors can include the nature of the asset, the expected duration of the holding period and the amount of leverage.

For example in real estate, purchasing a home with the intention of not living in it, or renting the property long term, would be considered an investment. Purchasing multiple properties with minimal down payments, and the intention of reselling hastily at a quick profit, would be an example of speculation.

The hope with the new tax is to turn empty underutilized homes into available housing for people who live and work in BC, and raise revenue that will support affordable housing. The introduction of the Speculation Tax will try to target foreign and domestic investors who own residences in British Columbia but do not pay taxes here.

What is the cost of the Speculation and Vacancy Tax?

The Speculation and Vacancy Tax rate will vary depending on the owner’s tax residency. In addition, the Tax rate varies based on whether the owner is a Canadian citizen or permanent resident of Canada, or a satellite family. How the Speculation and Vacancy Tax applies is based on ownership as of December 31 of each calendar year. Tax levied on December 31 is due the following July. For example, for a property owned as of December 31, 2018, the 2018 tax rate of 0.5% applies and the tax is due on July 2, 2019.

For 2018, the Tax rate is:

  • 0.5% of the property’s assessed value for all properties subject to the Tax

For 2019 and subsequent years, as of the date, the Tax rate is:

What cities of British Columbia are being taxed?

If you own a residential property in the following municipalities your home may fall under a taxable region, and may be eligible for the Speculation and Vacancy Tax.

How to declare your exemption for the Speculation Tax.

If you own residential property in one of the taxable cities on December 31, the Province will mail a Speculation and Vacancy Tax declaration letter around mid-February. If you are expecting a declaration letter, but haven’t received one by late February, please contact the British Columbia’s Speculation and Vacancy Tax line +1 (833)-554-2323 or e-mail spectaxinfo@gov.bc.ca.

Your declaration letter should list all the residential properties you own in the taxable regions, and will explain how to declare and claim any relevant exemptions. The letter will be sent to your mailing address on file with BC Assessment.

To update your mailing address, please contact BC Assessment.

The letter will include two unique identification numbers: a declaration code and a letter ID. These numbers will match you to your property and are needed to complete the declaration. Your Social Insurance Number will also be used to verify your identity.

If you are a corporation, you will need your incorporation number (ex. BC888888888). If you are declaring online, and your incorporation number has less than 9 digits, add zeros after “BC” until there are 9 digits (ex. BC008888888).

When you receive your declaration letter, you can complete your declaration through the online declaration application. You will be guided through the exemption options for each propertyYou can also declare over the phone with the help of an agent by calling after receiving your declaration letter. Different language translations are available over the phone.

A friend, family member or someone else can complete the declaration online for you if they:

  • Have the unique identification numbers from your letter
  • Have your Social Insurance Number
  • Complete an Authorization As A Representative form which can be found here.

If you have someone else complete your declaration over the phone, you also have to be present on the call.

What are the exemptions of the Speculation Tax?

There are exemptions available. BC’s government site states “that over 99% of British Columbians are estimated to be exempt…” For a full detailed and verified list of exemptions please visit: gov.bc.ca/spectax.

Some of the exemptions include:

  1. An owner can be exempt if the home is their principal residence, where the owner lives for a period longer than a calendar year. Owners with multiple homes will only be able to claim one property as their principal residence.

    Spouses will not be able to claim two different principal residences unless there is an exception. To be eligible for the exception your spouse would have to prove that you are living apart for medical reasons, work or are separated or divorced.

  2. If there is shared ownership, when more than one owner is on title in the taxable region, each owner can claim their relevant exemption as an individual. Different requirements could apply to different owners. Here are two examples provided by the provincial government.

    The first example provided mentions two parents who co-own a home in Victoria with their adult child. The parents live in Alberta. Their child would claim the principal residence exemption and the parents would claim the tenancy exemption for family or other non-arm’s-length persons.

    The next example provided mentions elderly parents that add their adult child on title to the parent’s condo in Vancouver. The parents live in the unit and their child lives in Northern BC. The parents claims the principal residence exemption and the child claims the tenancy exemption for family or other non-arm’s-length persons.

    For further reading please visit here.

  3. Property owners who have their home rented or lived in by a family member or an other non-arm’s-length person for at least six months in increments of one month or more at a time may be exempt (three months for 2018). It is important to double-check that the tenancy requirements were met. These requirements can be found here.

  4. For a property that is currently under construction or being renovated, the owner may be exempt from the tax, if reasonable steps are taken without undue delay to develop or renovate the property. For further information please visit here.

  5. If the property was just inherited or bought that year, the homeowners could be exempt.

  6. If the property owner has entered into residential care due to age, disability, illness or addiction the homeowner may be exempt for the tax for up to two years if the home was their prior principal residence.  The residential care must have services such as housekeeping, meals or nursing care.

  7. The homeowner may be exempt for medical reasons and need to be away from their principal residence to receive medical treatment for themselves, their spouse or a minor child. The treatment must be proven to be impractical to be treated closer to the owner’s previous principal residence. As of the date that this article was published, a Physician Certification Form must be filled out by a certified medical practitioner. This form can be found here.

  8. A bankrupt owner can be exempt from the tax if the owner’s property has vested with a trustee in bankruptcy for at least 60 consecutive days in the calendar year. A trustee in bankruptcy is exempt from the tax for property vested with the trustee as of December 31.

  9. If the owner of the property passes away in a calendar year, all other owners of the property at the time of death may be exempt in the year of death, and the immediate following calendar year.

  10. If the home is in a trust created by a Will for a minor, the Speculation and Vacancy Tax does not apply to a testamentary trust established by a deceased parent or guardian for the benefit of their minor child.

  11. A property that includes a licensed and operating daycare for children is exempt from the Speculation and Vacancy Tax.

  12. If the property was assessed at a value below $150,000.00, it will be exempt.

  13. A charity that is a registered owner of a property will be exempt from the Speculation Tax.

  14. If a property owner is an Indigenous Nation trustee or a government or related entity, they may be exempt.

  15. Reserve lands, treaty lands and lands of self-governing Indigenous Nations are exempt from the taxes.

  16. Corporations, partners and trustees that own properties in the taxable regions may also be exempt from the Speculation and Vacancy Tax. More information can be found here.

Why the Speculation and Vacancy Tax may be confusing for seniors.

As you can see, there’s a lot to read and understand in regard to the new speculation tax. This may be challenging for seniors, or those for whom English is not their first language. This article only covers some of the key points about the Speculation Tax, as more can be found online from the provincial government’s official site here. It is important to remember if you have parents or know of any other seniors, who are homeowners and English is not their first language, to help them complete their declaration because not everyone is legally- or tech-savvy. If you lend a helping hand, you may be saving them from being taxed on their home.  If you are a homeowner, ensure your Declarations are completed before March 31 2019, or click the source below to check for succeeding dates.

Source: https://www2.gov.bc.ca/gov/content/taxes/property-taxes/speculation-and-vacancy-tax

Read

Use Vancouver’s most sophisticated real estate tools — FOR FREE!

REAL ESTATE TOOLS & MAP