Vancouver Real Estate for June 2020 sees Increased Movement
June 2020 sees buyers and sellers more active in the real estate market for Vancouver. Home sales and listing activity return to typical historical levels. The Real Estate Board of Greater Vancouver reported that residential sales in the region reached a total of 2,433 in June 2020. Comparing this to last June, this was an increase to June 2019’s 2,077 sales.
Vancouver buyers and sellers are becoming more comfortable moving forward on purchases and sales. This is a huge difference compared to the start of the COVID-19 restrictions. Compared to last month, the numbers of solds have increased from May 2020’s 1,485 homes sold.
June 2020 Vancouver Real Estate Sales-to Listings Ratio
In continuing with the increased sales as mentioned above, it goes without surprise that Vancouver’s overall state is in a seller’s market. For all property types the sales-to-active ratios for June 2020 is 21.4%. Some analysts say upward pressure on home prices can occur when the ratio goes above 20% for several months.
Detached homes had a ratio of 19.9%. Putting detached homes in a high balanced market. Townhomes had a ratio of 25.2%. While condos had a ratio of 21.3%. This means that June 2020 is a seller’s market for attached homes.
Vancouver West’s June 2020 Real Estate Market
Detached
There were a total of 487 active listings for Vancouver West in the month of June. Out of the 487 homes, 78 of them sold. The benchmark price for detached homes was $3,076,700. Detached homes on the Westside had a sales-to-active ratio of 16%. This shows that the detached Westside is in a balanced market. Homes took an average of 58 days to sell.
Condo
Meanwhile on the Westside condo market there were a total of 1,465 active condo listings for the month of June. A total of 282 homes sold. This means that the active-to-list ratio was 19.2%. Showing a high balanced market. The benchmark price for condos was $789,300. Overall condos took an average of 26 days to sell.
Vancouver East’s June 2020 Real Estate Market
Detached
When looking at the Vancouver Eastside real estate market for June 2020, detached homes are in a sellers market. There were a total of 443 active listings and 105 sales. Unlike on the Westside the active-to-sale ratio was 23.7%. Overall the average days on market for detached Eastside homes was 26 days. The benchmark price for detached homes was $1,459,100.
Condos
Similarly condos on the Eastside were also in a seller’s market. June saw a total of 442 active listings and 130 sales. Although condos were in a much higher seller’s market with a ratio of 29.4%. Also similar to the detached market, condos took 26 days to sell. The benchmark price for June was $588,400.
North Burnaby’s June 2020 Real Estate Market
Detached
Also the detached market for North Burnaby was in a seller’s market. This means there was a total of 31 sales and 112 active listings. Bringing the active-to-sold ratio to 27.7%. Overall homes on average took 24 days to sell. The benchmark price for June 2020 was $1,488,200.
Condos
Condos were also in a seller’s market with an active-to-sold ratio of 22.1%. Unlike the detached market homes took longer to sell with the average being 39 days. The condos benchmark price was $605,500. There were a total of 285 listings and 63 sales.
Burnaby South’s June 2020 Real Estate Market
Detached
Unlike Burnaby North, Burnaby South is in a balanced market. There were a total of 165 detached listings and 24 sales. The ratio for actives-to-solds was 14.5%. Homes on average took 32 days to sell. Although the benchmark price of homes was higher compared to Burnaby North. Burnaby South’s benchmark price was $1,559,300.
Condos
Condos in Burnaby South were also in a balanced market. June saw a total of 310 active listings and 57 sales. The days on market average was 35. Condos in South Burnaby also had a higher benchmark price of $670,500 when compared to Burnaby North.
For the June 2020 stats provided by the Real Estate Board of Greater Vancouver click here.
And for last month’s market update click here.
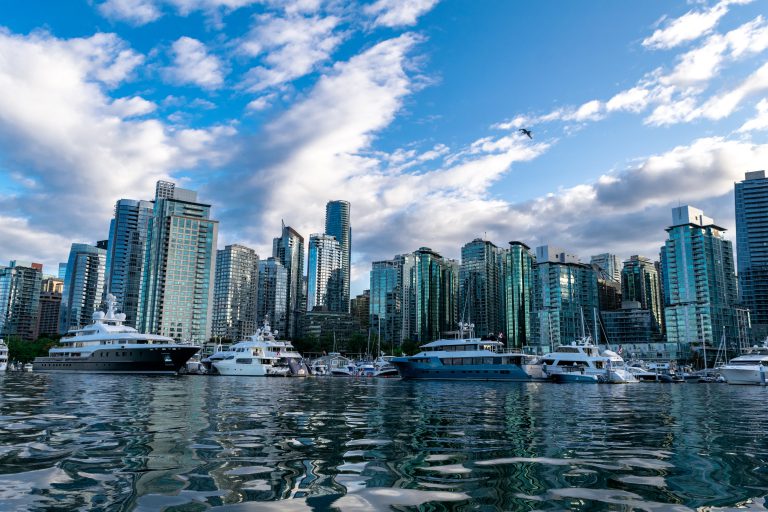
Photo by Himanshu Chanan on Unsplash.

 NOTE: This representation is based in whole or in part on data generated by the Greater Vancouver Real Estate Board, Fraser Valley Real Estate Board or Real Estate Board of Greater Vancouver which assume no responsibility for its accuracy. Copyright 2019 by the Real Estate Board of Greater Vancouver, Fraser Valley Real Estate Board, Chilliwack and District Real Estate Board, and BC Northern Real Estate Board. All Rights Reserved.